2011-2012 Work Time Visualized
Here are the visualizations for my work time for 2011-2012. I’ve also included updated charts for 2010-2011 by way of comparison.
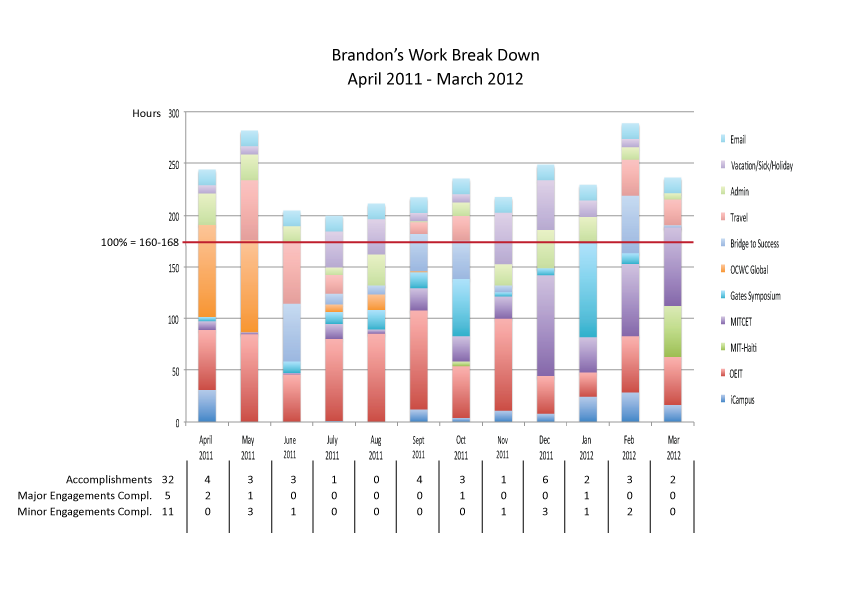
For April 2011-March 2012 (my annual review period at MIT), you can see a couple interesting things. There are a couple months each year that are significantly above “normal” — those tend to correspond to major events that I’ve hosted (Oct-Nov 2011 corresponds to the MIT-Haiti Symposium, April-May 2012 corresponds to OCWC Global 2011, February-March 2012 corresponds to MITCET Modularity experiments).
On to the charts!
[fusion_builder_container hundred_percent=”yes” overflow=”visible”][fusion_builder_row][fusion_builder_column type=”1_1″ background_position=”left top” background_color=”” border_size=”” border_color=”” border_style=”solid” spacing=”yes” background_image=”” background_repeat=”no-repeat” padding=”” margin_top=”0px” margin_bottom=”0px” class=”” id=”” animation_type=”” animation_speed=”0.3″ animation_direction=”left” hide_on_mobile=”no” center_content=”no” min_height=”none”]

2011-2012 Work Break Down, Stacked Column
[/fusion_builder_column][fusion_builder_column type=”1_1″ background_position=”left top” background_color=”” border_size=”” border_color=”” border_style=”solid” spacing=”yes” background_image=”” background_repeat=”no-repeat” padding=”” margin_top=”0px” margin_bottom=”0px” class=”” id=”” animation_type=”” animation_speed=”0.3″ animation_direction=”left” hide_on_mobile=”no” center_content=”no” min_height=”none”]

2011-2012 Time Break Down, Pie Chart
And for comparison, here are the updated 2010-2011 charts (same data, different colors to match the 2011-2012 charts).
[/fusion_builder_column][fusion_builder_column type=”1_1″ background_position=”left top” background_color=”” border_size=”” border_color=”” border_style=”solid” spacing=”yes” background_image=”” background_repeat=”no-repeat” padding=”” margin_top=”0px” margin_bottom=”0px” class=”” id=”” animation_type=”” animation_speed=”0.3″ animation_direction=”left” hide_on_mobile=”no” center_content=”no” min_height=”none”]


2010-2011 Work Break Down, Stacked Column and 2010-2011 Time Break Down, Pie Chart
[/fusion_builder_column][/fusion_builder_row][/fusion_builder_container]