
Time Breakdown 2009-2010
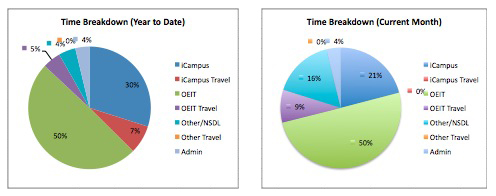
As a followup to a comment I made to Chris on my Visualizing 2010-2011 post, here’s a pie chart visualization of my time spent, by project for OEIT for 2009-2010.
[fusion_builder_container hundred_percent=”yes” overflow=”visible”][fusion_builder_row][fusion_builder_column type=”1_1″ background_position=”left top” background_color=”” border_size=”” border_color=”” border_style=”solid” spacing=”yes” background_image=”” background_repeat=”no-repeat” padding=”” margin_top=”0px” margin_bottom=”0px” class=”” id=”” animation_type=”” animation_speed=”0.3″ animation_direction=”left” hide_on_mobile=”no” center_content=”no” min_height=”none”]

Time Breakdown 2009-2010 and Time Breakdown for June 2010
(I’d like finer grain detail, but as it stands I sometimes forget to track even this level of data in a timely manner.)[/fusion_builder_column][/fusion_builder_row][/fusion_builder_container]