
Visualizing 2010-2011
Things at work are picking up again, and I started to get concerned with how the projects and activities that are on my plate interact with each other. So, I thought I’d play around with a visualization of this time. Here’s my first attempt.
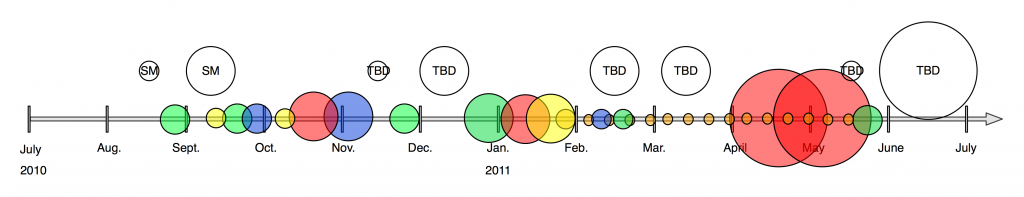
The circle represent major events, like conferences, meetings and also vacation time. The colors represent the different kinds of activities. The empty/white circles represent big time chunks where I might be able to take on additional activities. The size of the circle is something akin to the time commitment and relative importance of the event. I don’t think the size is a linear scale, it’s sorta “it feels right.”
[fusion_builder_container hundred_percent=”yes” overflow=”visible”][fusion_builder_row][fusion_builder_column type=”1_1″ background_position=”left top” background_color=”” border_size=”” border_color=”” border_style=”solid” spacing=”yes” background_image=”” background_repeat=”no-repeat” padding=”” margin_top=”0px” margin_bottom=”0px” class=”” id=”” animation_type=”” animation_speed=”0.3″ animation_direction=”left” hide_on_mobile=”no” center_content=”no” min_height=”none”]

Time Visualization
I wish there was a visualization script or program that would do this for me–but I didn’t find one with my quick searches.[/fusion_builder_column][/fusion_builder_row][/fusion_builder_container]
I have wanted a “my pie chart of time over time” tool for ages.
At one point I had a rigid division by days of week, i.e., course prep and teaching only happens on certain days, and so on.
I’ve started sketching ideas including starting each week with a hand-estimated list of percentages for research, teaching, and service.
I tried using LifeBalance but found it too cumbersome.
Got any ideas on how you do this over time? Using project management software and project managing things seems like the wrong model for me.
I’ve thought about something similar, a “chart of time over time.” This one was all about, will I have any time to take on new projects this year? The answer, not so much. I should probably go back over the last few years and do the same thing. This didn’t really take that long since I focused on big activities, like conferences, vacation, and the such. One thing I hoped to capture was that going away to a conference for a week, or traveling internationally has a readjustment time on the return side. It’s not just the time I’m gone but the lead up and the return as well.
Breaking the problem down, there’s the data collection and the visualization.
I’ve been tracking my time on a really gross level for the last couple of years in a simple spreadsheet–not the activities that I’ve done (like class prep, proposal writing, paper writing) but rather the general project areas I’ve worked on (e.g, SpokenMedia, OEIT, administrative stuff). I also use it to try and achieve some sort of balance–not spending a crazy amount of time working. I think when I first started at Berkeley way back when I was averaging 60 hour work weeks. I have no good thoughts about displaying this data.
I started using Daytum earlier this year to track a few things–weekly email inbox size, daily fruit consumption (which I’ve failed miserably at keeping up to date), bike ride distance, number of books and papers read. What’s nice is that they’ve got a couple pre-built visualizations (bar charts, pie graphs) for each one, but they don’t default to an over time display.
For the way you describe things, I think something akin to time tracking software for consultants is how you want to capture your data since it’s more fine grained. So at least you have it. Webworker Daily is being annoying right now, but I think they’ve covered some interesting apps to help with tracking the last year and a half. But then, maybe it was Lifehacker.
How to display it I have no idea. Somehow simple bar and pie charts doesn’t seem to be it. In one way, with my data, I’d like to see an animation over time of each of the project areas as a circle along an axis, as time progresses, each circle would grow or shrink depending on what I was spending more time on. It could be daily or it could be monthly. I guess I could see a line chart representation of this over time as well. Hrm, maybe I’ll have to try that.