Comparison: Brandon & Boston Spending
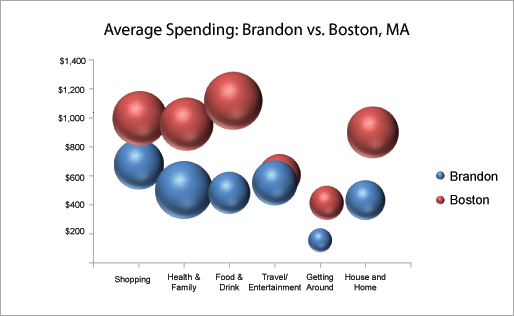
I ran across Bundle in an article about cost of living in the San Francisco Bay Area. I entered in my specifics and produced this chart comparing my expenses (excluding mortgage and rent) and those in my categories (age, income, single, male, no kids) in Boston. I then compared it as closely as I could with the data I track at Mint.com.
[fusion_builder_container hundred_percent=”yes” overflow=”visible”][fusion_builder_row][fusion_builder_column type=”1_1″ background_position=”left top” background_color=”” border_size=”” border_color=”” border_style=”solid” spacing=”yes” background_image=”” background_repeat=”no-repeat” padding=”” margin_top=”0px” margin_bottom=”0px” class=”” id=”” animation_type=”” animation_speed=”0.3″ animation_direction=”left” hide_on_mobile=”no” center_content=”no” min_height=”none”]

Brandon vs. Boston Spending
With the exception of Travel/Entertainment, my spending is well below Bundle’s “average”. In all, about $1,900 less. Though I think some of that is made up with my probably higher than average rent for a single male–I’m guessing most would have roommates. And I “benefit” by not having home improvement expenses. It’s also probably worth saying that the data Bundle uses is based on what Bundle users are spending. So the data is probably skewed in any number of ways.
But you can check it out for yourself, look at Everybody’s Money.[/fusion_builder_column][/fusion_builder_row][/fusion_builder_container]